
Fleet Safety
Reduce Risk. Protect Your People. Keep Your Fleet Moving.
Every vehicle in your fleet carries more than people and equipment. It carries a job that needs to get done, a customer waiting on service, and revenue that depends on that vehicle staying on the road.
A collision can disrupt all of it.
Auto Advocate helps you understand where your fleet is exposed, what those incidents cost your operation, and which practical changes could help. We start with your vehicles, your drivers and your experience before recommending a solution.
Safety Affects Every Part of Your Operation
- $62 billion
- Annual direct crash-related expenses to U.S. employers, including medical care, liability, lost productivity and property damage.
- Network of Employers for Traffic Safety
Keeping your drivers safe matters. So does understanding what happens to your business when an accident takes a driver or vehicle out of service.
Some costs arrive as invoices: repairs, towing, deductibles and replacement transportation. Others show up in your schedule. Employees lose productive hours. Deliveries get delayed. Service calls get moved. Someone spends time coordinating repairs, handling the claim and keeping customers informed.
Motor vehicle crashes cost U.S. employers approximately $62 billion annually in direct crash-related expenses, according to the Network of Employers for Traffic Safety. Those expenses include medical care, liability, lost productivity and property damage.
Your fleet's share of that problem depends on how you operate.
We help you examine where incidents happen, which vehicles are involved, how often they occur and how long they disrupt your operation. That gives us a useful starting point for deciding where a change could make the greatest difference.
Your Driver Can Do Everything Right and Still Get Hit
- 2.19 million
- Rear-end crashes recorded in NHTSA's 2019 data.
- NHTSA
- 595,000
- Of those were injury crashes.
- NHTSA
You can hire good drivers, maintain your vehicles and establish solid safety practices. You still have limited control over the driver behind you.
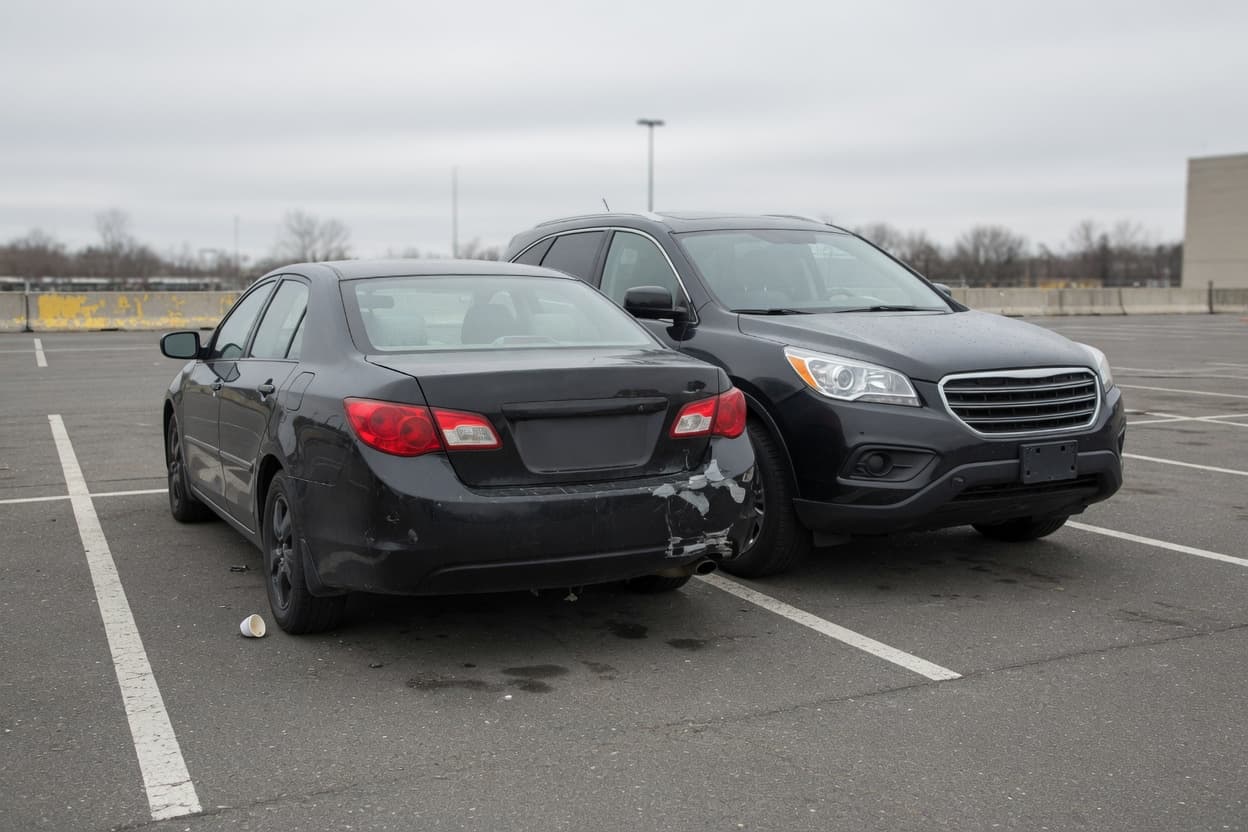
A distracted or inattentive driver can turn an ordinary stop into an injury, a repair bill and weeks of disruption.
NHTSA's 2019 data recorded approximately 2.19 million rear-end crashes, including roughly 595,000 injury crashes. For fleets, those incidents can affect far more than the damaged vehicle.
A service truck may carry equipment that another vehicle cannot accommodate. A delivery vehicle may have a full route waiting. A specialized work truck may be difficult to replace while repairs are underway.
Even when your driver did nothing wrong, your business still has to deal with the consequences.
The question we ask is simple:
What happens inside your operation when one of your vehicles gets rear-ended?
Understanding that answer helps us evaluate ways to reduce your exposure.
The Repair Bill Is Only the Beginning
- $16,500
- Estimated average employer cost per crash.
- Older OSHA and NHTSA employer guidance
- $74,000
- When an on-the-job crash involved an injury.
- Older OSHA and NHTSA employer guidance
The cost of a collision reaches beyond what the body shop charges.
There may be towing, medical expenses, damaged equipment, replacement transportation and an insurance deductible. Your team may also spend hours reporting the incident, coordinating repairs, managing the claim and rearranging work.
Older OSHA and NHTSA employer guidance estimated an average employer cost of approximately $16,500 per crash, rising to about $74,000 when an on-the-job crash involved an injury. Those historical figures illustrate how quickly the consequences can extend beyond vehicle damage.
Your own costs are the numbers that matter most.
We help you look at repair expenses, days out of service, employee time, replacement vehicle costs and lost productivity. We also consider how incidents affect customers, schedules and the people responsible for keeping the operation running.
Once those costs are visible, you can make a more informed decision about safety spending, and what a reduction in incidents could mean for your fleet.
When a Vehicle Stops, the Disruption Keeps Moving
A vehicle waiting for repairs cannot run its route, make its service calls or move the equipment your crew needs.
The work still has to get done.
Another driver may absorb the route.
A crew may need overtime.
A customer may have to wait.
You may rent a replacement vehicle that costs more and does less than the one it replaces.
For some fleets, the disruption lasts longer than the repair itself. Parts availability, specialized equipment and scheduling can all affect when a vehicle returns to work.
That is why we evaluate safety measures against the full operational cost of an incident.
If a proposed solution can help reduce collision exposure, we want to understand what that could mean in fewer lost workdays, fewer interrupted jobs and less time spent managing the aftermath.
See How Brake Plus Works
A following driver has to notice that your vehicle is slowing and react. Brake Plus is designed to make that braking event more noticeable by adding a brief pulsating light signal.
The goal is to draw the following driver's attention to your braking vehicle.
Build Safety Around the Risks Your Fleet Faces
Fleet safety involves several working parts: driver selection, training, policies, vehicle maintenance, visibility and appropriate safety technology.
The right approach depends on your operation.
We look at your incident history, vehicle types, operating conditions and existing practices. Then we help you evaluate changes that address the risks you are actually experiencing.
One available tool is Brake Plus.
An Additional Visual Cue for Following Drivers
Brake Plus connects to selected brake lights and causes them to pulse four times when the brake pedal is applied. That brief pulse creates an additional visual cue for a driver approaching from behind.
For fleets concerned about rear-end collisions, it offers another way to make a braking vehicle more noticeable.
Brake Plus reports fleet results showing reductions of up to 50% in rear-end collisions. Individual fleet results will vary.
Practical Considerations for Your Fleet
Brake Plus describes its fleet system as non-invasive, with installation or removal taking approximately five minutes. Units can be transferred between compatible vehicles, and the manufacturer offers a five-year warranty.
That transferability can be useful when vehicles are replaced. A unit may move to the next compatible vehicle rather than leaving the fleet with the one being sold.
We help you evaluate compatibility, installation, replacement schedules and the potential business case before deciding how the system fits your operation.
Tire Safety Is Part of Fleet Safety
Tire condition and maintenance belong in your fleet safety review. A tire problem can leave a driver dealing with a disabled vehicle, a roadside service call and an interrupted route.
We look at your inspection and maintenance practices, recurring tire incidents and the conditions your vehicles operate in. From there, we can evaluate preventive measures and protection options that fit your fleet.
Our Tires & Downtime page takes a closer look at those problems, their operational costs and available approaches, including PermaSeal and Tire & Wheel protection.
Measure What Changes
A useful evaluation starts with your current experience.
Track rear-end incidents, miles driven, accident severity and days out of service. After implementation, compare incident rates across comparable mileage and operating conditions.
That gives your fleet a clearer picture of what changed and whether the investment is delivering value.
An Oklahoma Fleet Comparison Across Approximately 90 Million Miles
- 90 million
- Miles of operation compared, roughly half with Brake Plus and half without.
- 34%
- Observed reduction in being rear-ended for the equipped vehicles.
An Oklahoma fleet evaluation compared approximately 90 million miles of operation, with roughly half driven by vehicles equipped with Brake Plus and half by vehicles without it.
The equipped vehicles experienced an observed 34% reduction in being rear-ended.
For a fleet operator, the next question is what a similar reduction could mean within their own operation. The answer depends on incident frequency, severity, repair expenses and downtime.
An observed result from one fleet does not guarantee the same outcome for another. It does provide a reason to examine the approach and measure its performance under your own operating conditions.
Put Your Fleet's Safety Costs Into Perspective
Your accident records and repair invoices are a useful starting point. Bringing downtime, employee time and replacement transportation into the same review helps reveal the full cost.
Auto Advocate can help you organize that information and identify where a closer look may be worthwhile.
Understand Your Accident Costs
Review the expenses associated with each incident, including repairs, towing, deductibles and replacement transportation. Add the employee hours, administrative time and work disruption that may not appear on an invoice.
Review Your Rear-End Collision History
Look for patterns in the vehicles involved, operating locations, incident severity and days out of service. Compare incidents against miles driven so changes in fleet activity do not distort the picture.
Review Your Existing Safety Practices
Consider driver policies, training, maintenance, visibility, safety technology and accident-response procedures. Understanding what is already working helps identify where additional support could be useful.
Need Help Getting Started?
Talk to a Fleet Advocate.The Auto Advocate is paid when you buy a product discussed on this page. Every one is optional.
Let's Look at Your Fleet.
Tell us what is happening in your operation.
We will start with your vehicles, accident history, downtime and current safety practices. Together, we can identify the biggest areas of exposure and understand what they are costing you.
From there, we can evaluate which changes or tools make sense for your fleet.
Whether you are dealing with repeated rear-end incidents or simply want a clearer picture of your safety costs, we are here to help you work through it.